Dynatrace pricing
Transparent, simple to understand, and scalable with your demands. Dynatrace Platform Subscription offers flexible options that can grow with your business.
Usage based
- Pay only for what you use
- Access any capability available to your deployment model/cloud environment – no restrictions or extra fees
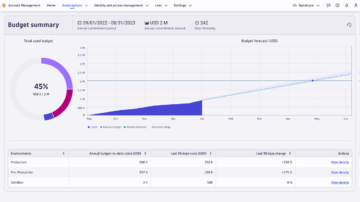
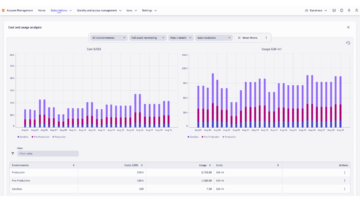
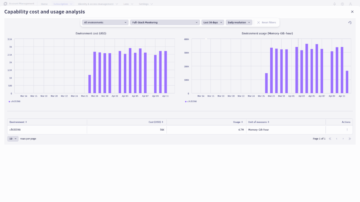
- Track and control your usage, budgets, and costs with built-in tools
Commit and save
- Volume discounting that scales with annual commit
- No penalties for exceeding commit
- Unlimited seats, full visibility, smarter decisions
Flexible and transparent
- No billing surprises
- Scale up or down as your needs change
- Forecast spend with real-time insights and pro-active alerts
Predictable pricing.
Exceptional capabilities.
Your subscription includes our industry-leading capabilities and platform technologies like Davis AI, Grail, and Smartscape. Multi-year and volume-based discounts are available.
Application and Infrastructure Observability
End-to-end observability for applications and infrastructure. Extendable with Log Analytics, Digital Experience Monitoring, Code Monitoring, and Application Security.
Choose Foundation or Infrastructure for infrastructure only, Full-Stack for both application and infrastructure observability.
Foundation & Discovery
Basic infrastructure monitoring and IT inventory.
- Basic host health indicators
- Host and process topology detection
- Filesystem monitoring (ex: disk usage)
- OS services monitoring
*Billed at $0.01 per hour per host
Infrastructure Monitoring
Infrastructure observability for cloud, hyperscaler, and data center.
- Everything included in Foundation & Discovery
- Process, disk, memory, and network analysis
- Correlation of logs in context of hosts, cloud services, databases, network
- Custom metrics for extensibility
*Billed at $0.04 per hour per host
Full-Stack Monitoring
Comprehensive observability for apps, microservices, and infrastructure.
- Everything included in Infrastructure Monitoring
- APM
- Automated root cause analysis for E2E transactions
- Code-level profiling
- Kubernetes Platform Monitoring
- OpenTelemetry metrics and traces
- 10 days of trace data retention, extendable to 10 years
*Billed at $0.01 per memory-GiB-hour
Container Observability
Observability of cloud-native containerized environments, from infrastructure to application, down to the code level. Extendable with Real User Monitoring, Log Analytics, and Application Security.
Kubernetes Platform Monitoring
Visibility into Kubernetes clusters, nodes and workloads.
- Kubernetes metrics and events: CPU, memory, network, and more
- Health views and explorative analysis with data in context
- Resources and topology
- Included on hosts with Full-Stack Monitoring for no additional charge
*Billed at $0.002 per hour per pod
Code Monitoring
Troubleshoot and debug your code live in production instantly.
- Live code troubleshooting and debugging
- Non-breaking breakpoints
- Integration with Visual Studio Code and JetBrains
*Billed at $0.005 per hour per container
Log Analytics
Analyze logs in context and make smarter decisions when troubleshooting or measuring the health of your environments. Extendable with Application and Infrastructure Observability, Digital Experience Monitoring, and Application Security.
Mix and match your logs pricing model across your environment, according to your use-case.
Pay-per-Query
Pay only for the data you use.
- Automated data ingestion & processing, topology enrichment
- Advanced data transformation
- Conversion to time series
- DQL-powered analytics & querying: on-read parsing, aggregation, reporting
- Data retention control from 1 day to 10 years
Bundled Queries
Retention with included queries for budget predictability.
- Automated data ingestion & processing, topology enrichment
- Advanced data transformation
- Conversion to time series
- DQL-powered analytics & querying: on-read parsing, aggregation, reporting
- Minimum 10, up to 35 days retention with queries included, extendable with usage-based option
Digital Experience Monitoring
Comprehensive monitoring for real user experience and synthetic testing across web, mobile, and API environments. Extendable with Application and Infrastructure Observability, Log Analytics, and Application Security for true end-to-end observability.
Choose Real User Monitoring or Real User Monitoring with Session Replay for all RUM features plus visual replay.
Real User Monitoring
Gain full visibility into how end users experience every digital transaction across web, mobile, and single-page applications.
- Capture and analysis of customer experience in every digital transaction
- Mobile application monitoring and crash analysis
- 35 days of data retention
*Billed at $0.00225 per session
Real User Monitoring with Session Replay
Capture and visually replay the complete digital experience of end users to easily reproduce production issues and errors.
- Everything included in Real User Monitoring
- Movie-like visual replay of end user experience
- 35 days of data retention
"Billed at $0.0045 per session with replay capture
Synthetic Monitoring
Browser monitor
Monitor business-critical workflows by simulating user visits.
- Web-based recorder
- Scripted transactions
- Private locations
- 35 days of data retention
*Billed at $0.0045 per synthetic action
HTTP monitor
Check availability and performance of internal and external resources—websites or API endpoints.
- Analytics tracking availability, response time, HTTP status codes
- Global public and private synthetic locations
- 35 days of data retention
*Billed at $0.001 per synthetic request
Application Security
Immediate and continuous actionable insights across your complete environment. Security findings integrated in core observability apps and workflows.
Choose Runtime Vulnerability Analytics to surface critical exposures in your environment. Add Runtime Application Protection to block exploitation attempts.
Runtime Vulnerability Analytics
Detect and remediate critical 1st and 3rd party vulnerabilities at runtime.
- Detect 1st party code vulnerabilities and 3rd party vulnerabilities
- Automatic prioritization by risk and impact
- Ingest and analyze external security findings
*Billed at $0.00225 per memory-GiB hour
Runtime Application Protection
Protect against and block exploitation attempts of your applications at runtime.
- Protects against top relevant OWASP security risks
- Blocking of exploitation attempts
- Covers 1st party code vulnerabilities
*Billed at $0.00225 per memory-GiB-hour
Security Posture Management
Stay compliant with key security guidelines and industry standards.
- Continuously identify and resolve misconfigurations
- Detect and address security issues impacting your compliance at runtime
- Evidence creation for auditing purposes
- Covers compliance standards including CIS, NIST, DORA, HIPAA and more
*Billed at $0.007 per host-hour
Includes full access to Dynatrace’s unified platform
Our technologies deliver precise answers and automation through hypermodal AI, with automatic discovery and topology mapping across billions of dependencies.
-
Grail
Our data lakehouse designed for observability, unifying logs, metrics, traces, and events into a real-time, topology-aware model.
-
Smartscape
Real-time, auto-discovered topology that maps all components and their dependencies across applications, services, processes, hosts, and data centers.
-
Davis AI
Run real-time analysis on observability and security data to detect anomalies, correlate events, pinpoint root causes and prioritize problems.
Contact us
Volume discounts are available. Speak with our pricing experts to find the best fit for your organization.
715+
supported technologies
We’re open and extensible, and integrate with all major cloud platforms and solutions.
See what Dynatrace can do for your business
Dive deep into IDC's thorough, detailed white paper to learn exactly how Dynatrace drives success.